Bloomberg Today View
UX design / Usability Testing / Scrum / User Research
Overview
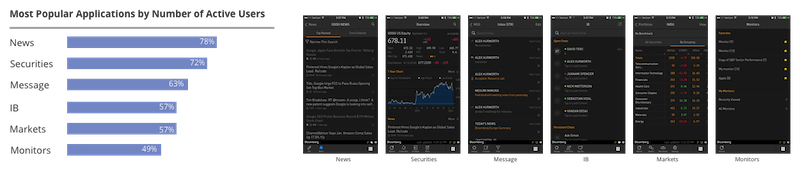
Two major findings motivated this project: 1) Most Bloomberg mobile users are using only handful of applications/features, 2) Most of them are using mobile during morning hours, typically during commute. Goal was to provide market information with navigational efficiency to let them prepared before they get into the office.
Conducted user interviews, followed by brainstorm, ideation, sketch sessions, then card sorting exercise with 34 clients. After though analysis of collected data, final ranking of suggested cards were presented.
Background
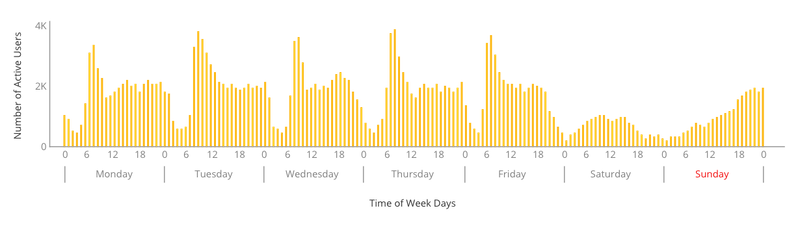
From user metric data for the actual usage of the application, peak usage time of mobile application turned out to be during morning hours between 6am to 9am. This means once they get to their desks, their main mode of use switched from mobile to desktop. This finding motivated this project of today view card to provide timely and relevant information especially during morning hours.
In-house interviews
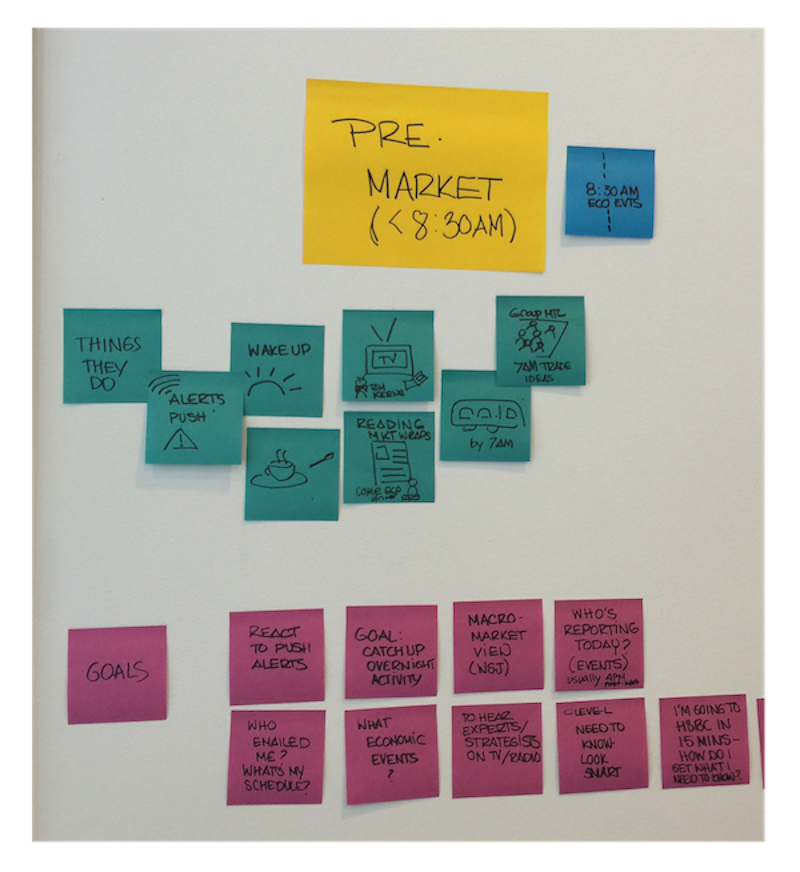
To get a detailed level of understanding around morning hour needs, in house application specialist were recruited who were familiar with the workflows and needs of various player types of Bloomberg users. New ideas were suggested based on the initial findings from interviews with application specialists.
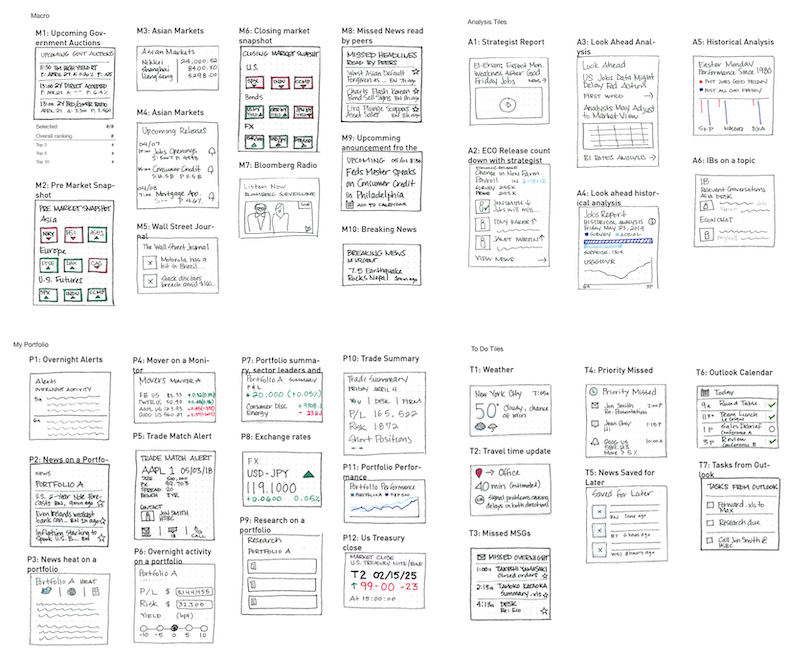
Cards sketches
Ideas collected from brainstorm sessions were sketched as different set of cards, categorized by four groups - macro, analysis, portfolio and to do cards.
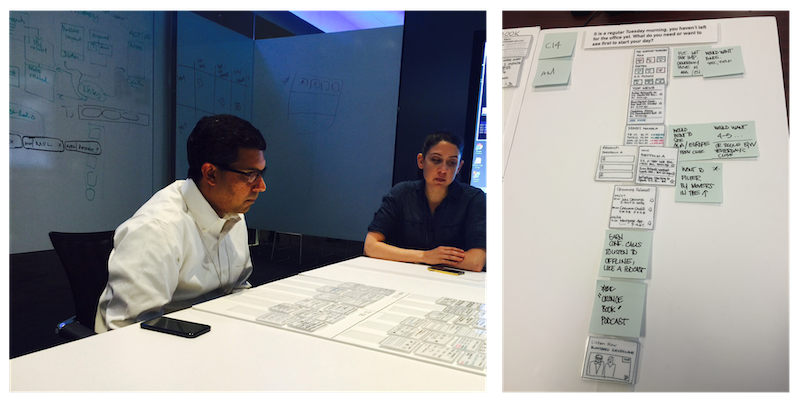
Client interviews
In order to validate the content on the cards sketched and understand the priorities of them, client interview session was planned and scheduled with 34 clients - mixed with balanced player types and asset classes. They were asked to review the cards on the table and rank them in order of priority.
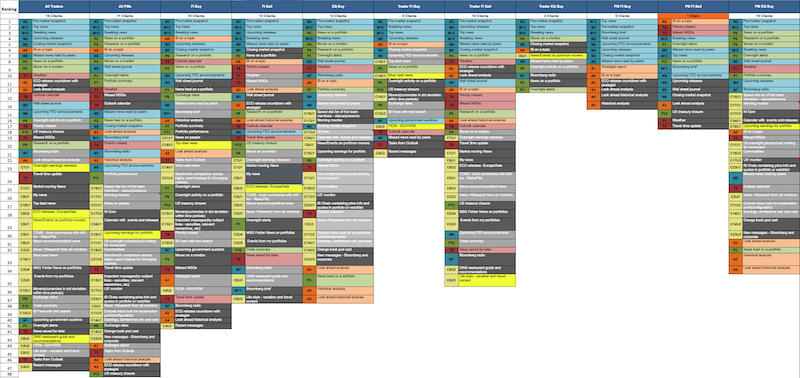
Card ranking
Collected information was coded in excel spreadsheet and ranking per each player type and asset class were prepared using VBA coding. Color represented each group of cards, e.g., blue indicates macro market related cards. The ranking shows most of them ranked macro market cards towards top position.
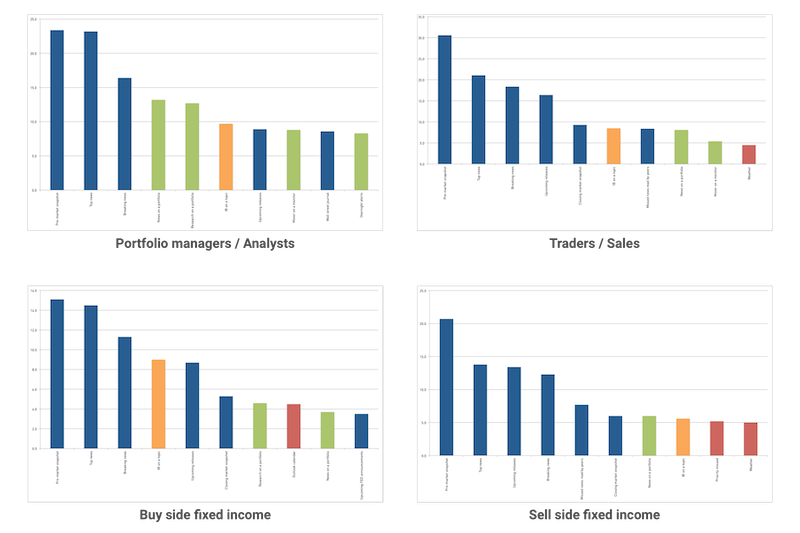
Frequency analysis
Following are the bar graphs showing number of selection within player type or asset class. Blue bar indicates macro cards, green as portfolio cards, orange as analysis cards and red as to do cards. Across the different player types and asset classes, macro cards were prioritized over the others globally.
Sort order comparison
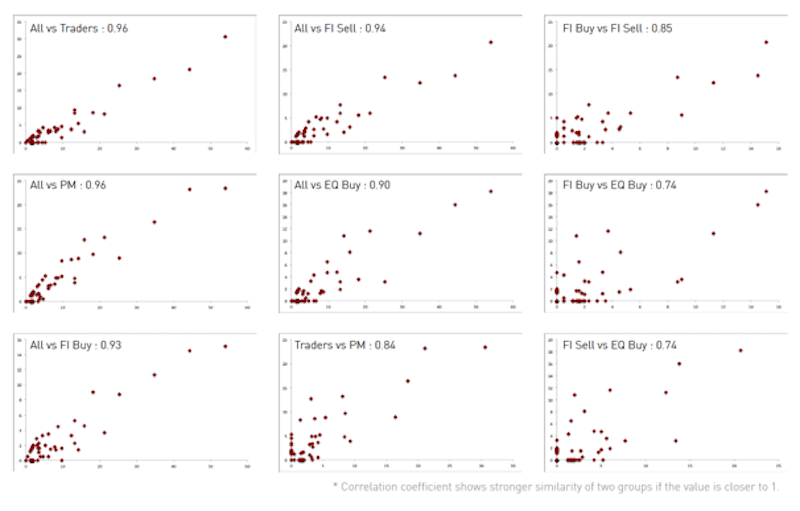
Correlation coefficient were calculated between ranking orders of player types, asset classes and buy/sell side to see if they were statistically related. Some shows strong correlation as the values were close to 1. In most cases, the values were at least 0.7 and higher, we concluded that differences in card ordering between player types, asset classes and sell/buy side was not significant to consider. Thus we can provide single order of cards to represent most clients.
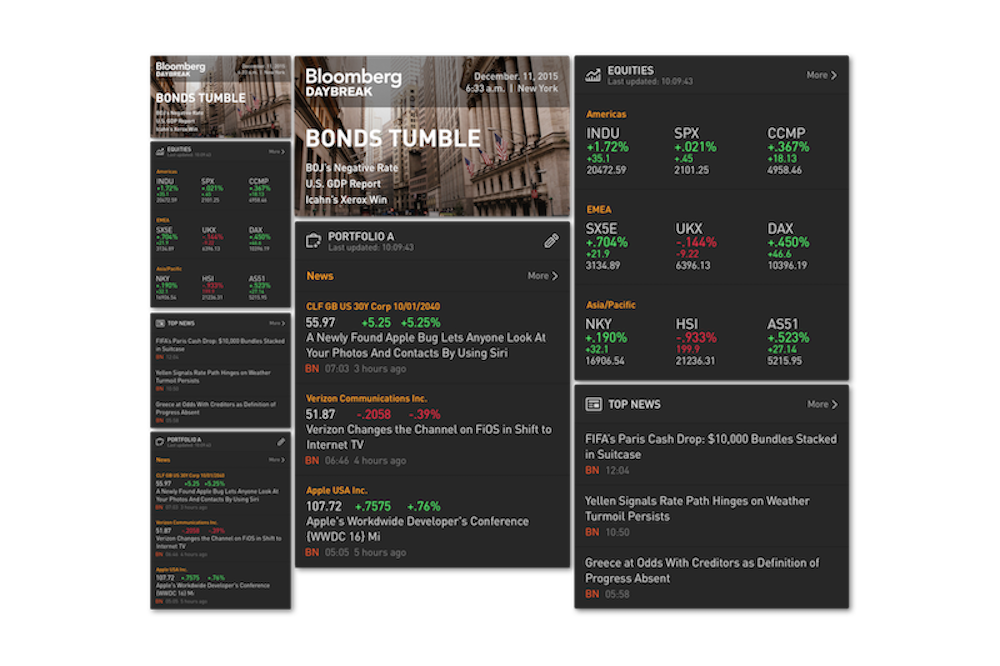
Final sort order
Based on the findings from interviews and analysis, following top 4 cards were decided. Bloomberg daybreak, Market overview, Top news and News on portfolio cards.
Take away
For the initial release, we decided to provide the same 4 cards for all users. On an ideal condition, if we could capture users previous usage patterns either from mobile or desktop, we never have to rely on client interviews to figure out the content and ordering of them. Also, the number we got on this study may not represent the actual needs of entire user groups.